DATA VISUALIZATION
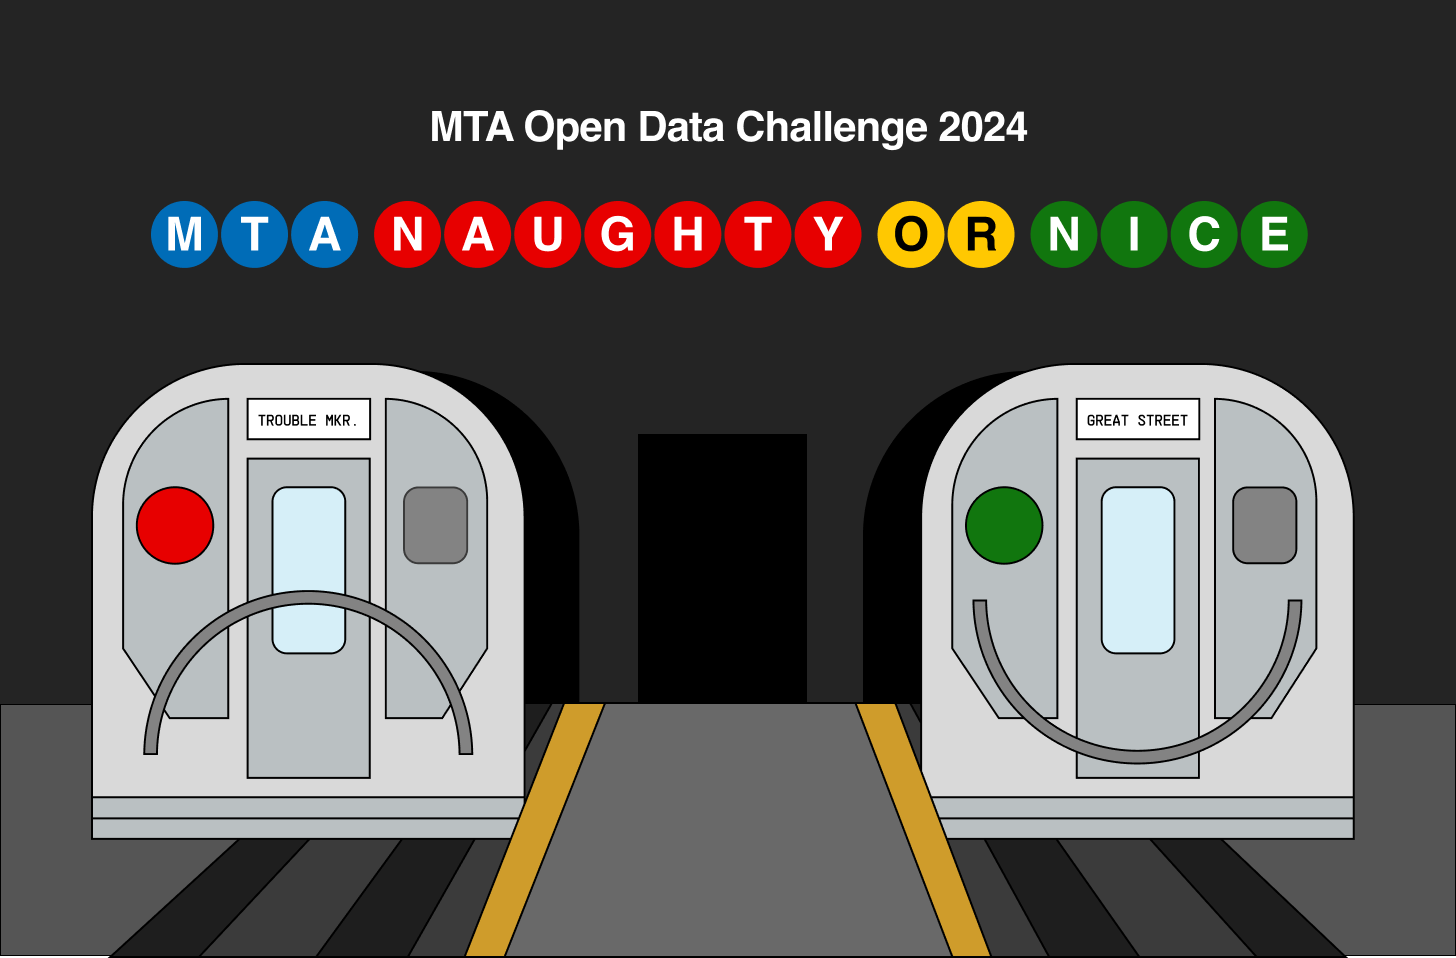
MTA Naughty or Nice
Awarding the Naughty train line of the month, and Nice train line of the month.
OVERVIEW
We rank each MTA service based on three criteria to award the Naughtiest and Nicest Line of the Month for each month in 2023.
CONTRIBUTORS
Zack Abu-Akeel, Kristina Cheng, Hank Shen
Special thanks: Gifan Thadathil
LINK
THE BRIEF
The MTA Open Data challenge
The MTA Open Data Challenge is a month-long competition invites community members, developers, and data enthusiasts to harness the power of MTA's open data. For our project, I was the main product designer, web developer, and illustrator. I made everything in Figma and developed it with Next.js. My teammates handled all the data cleanup, analysis, and insights.
THE QUESTION
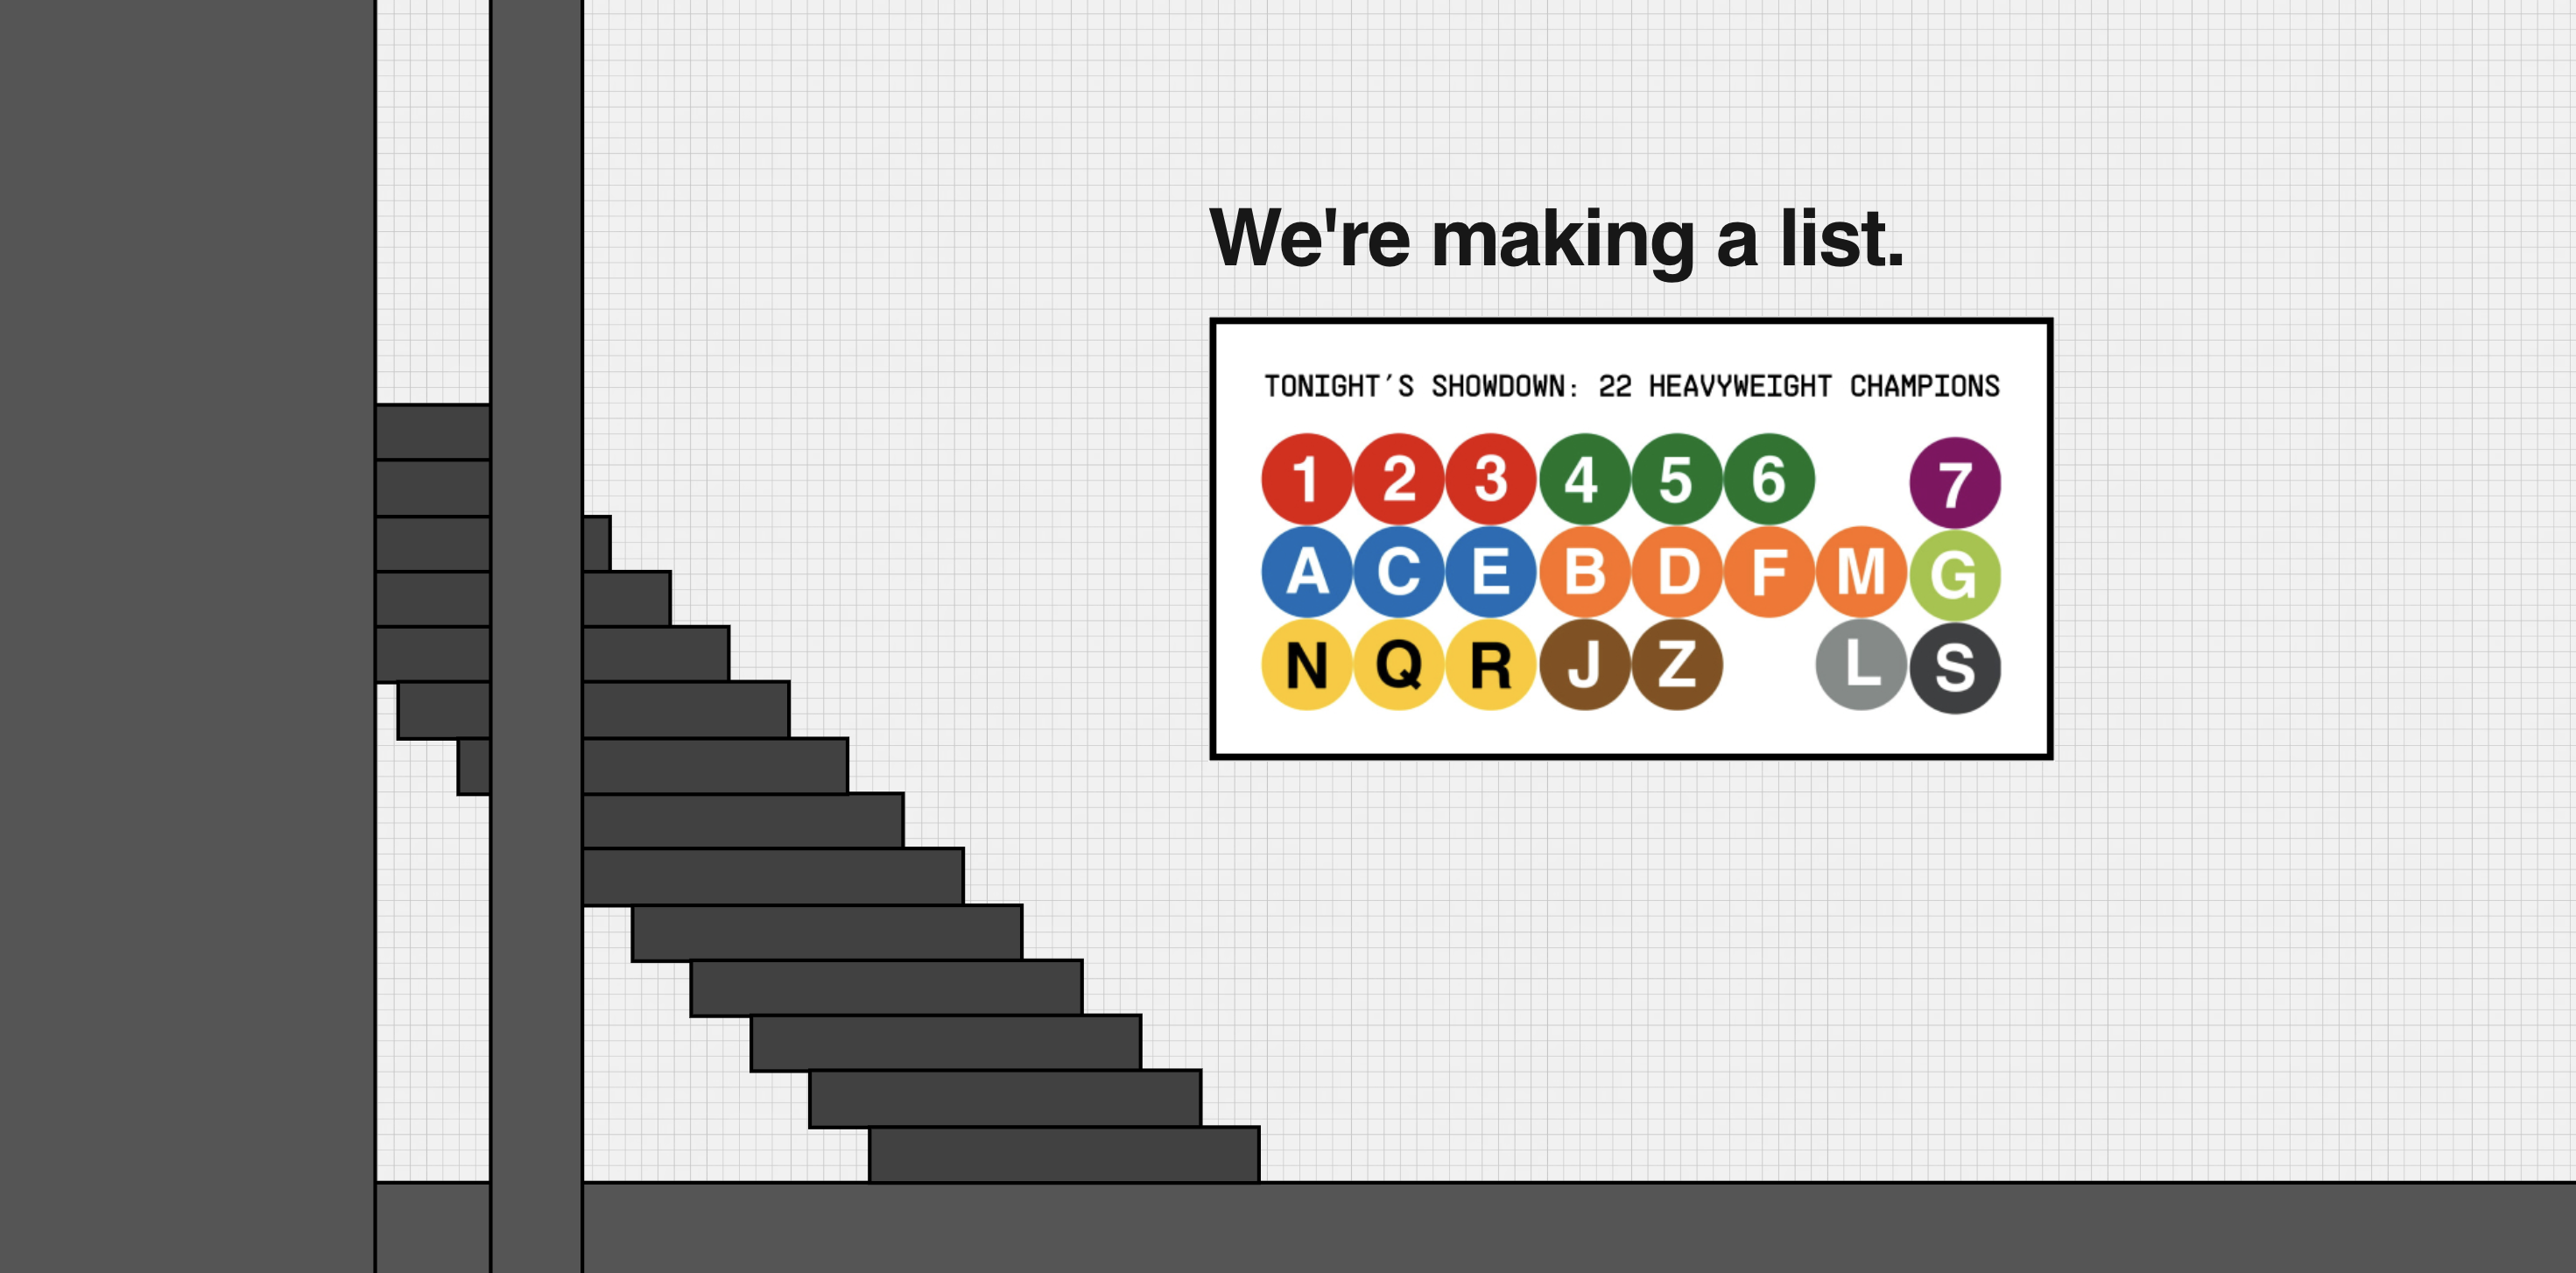
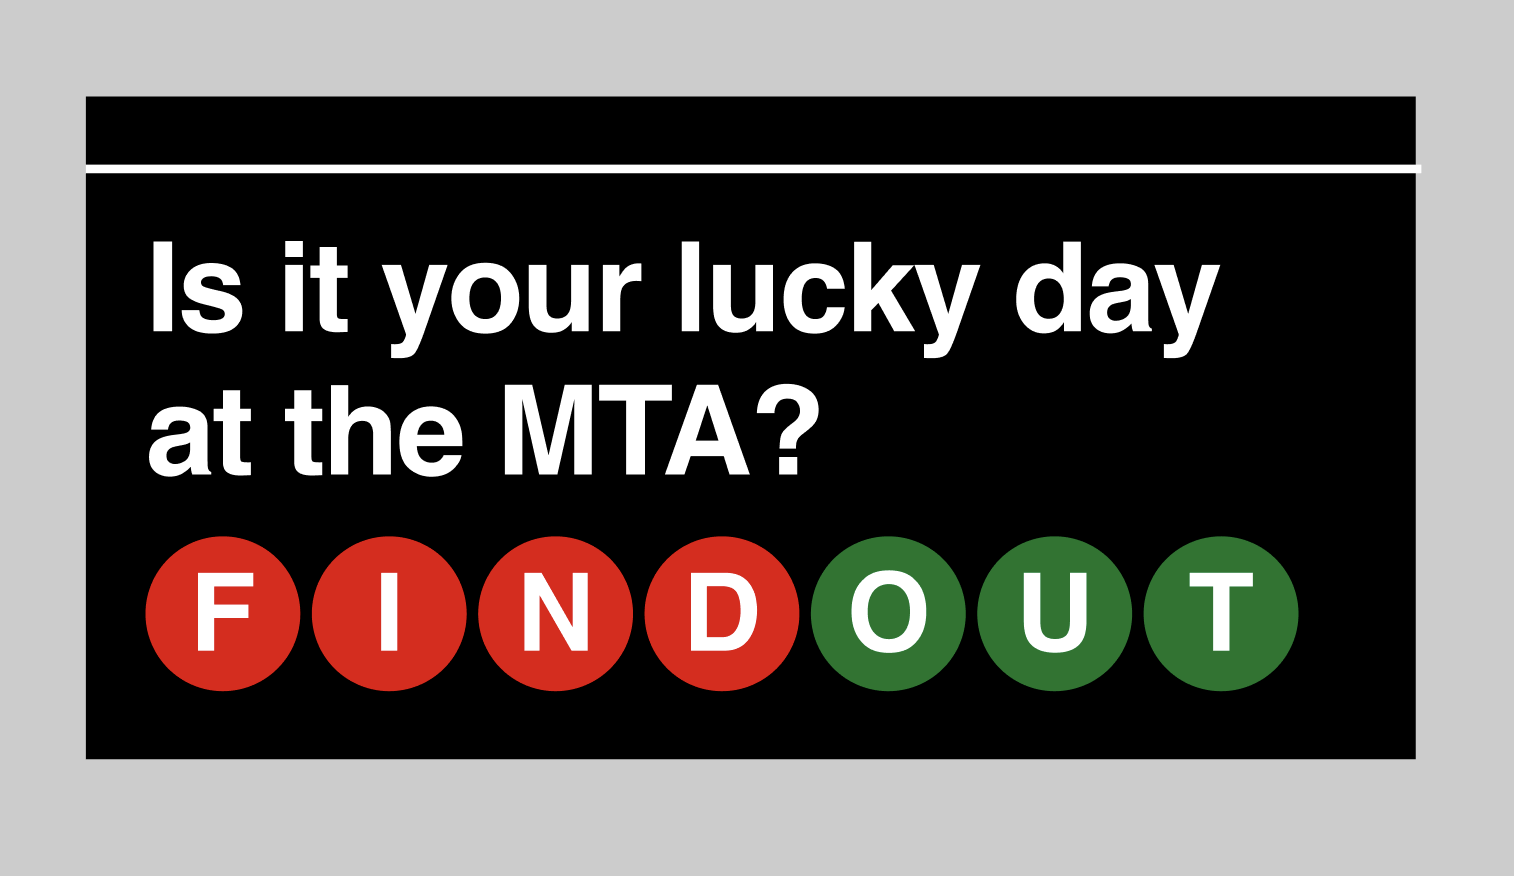
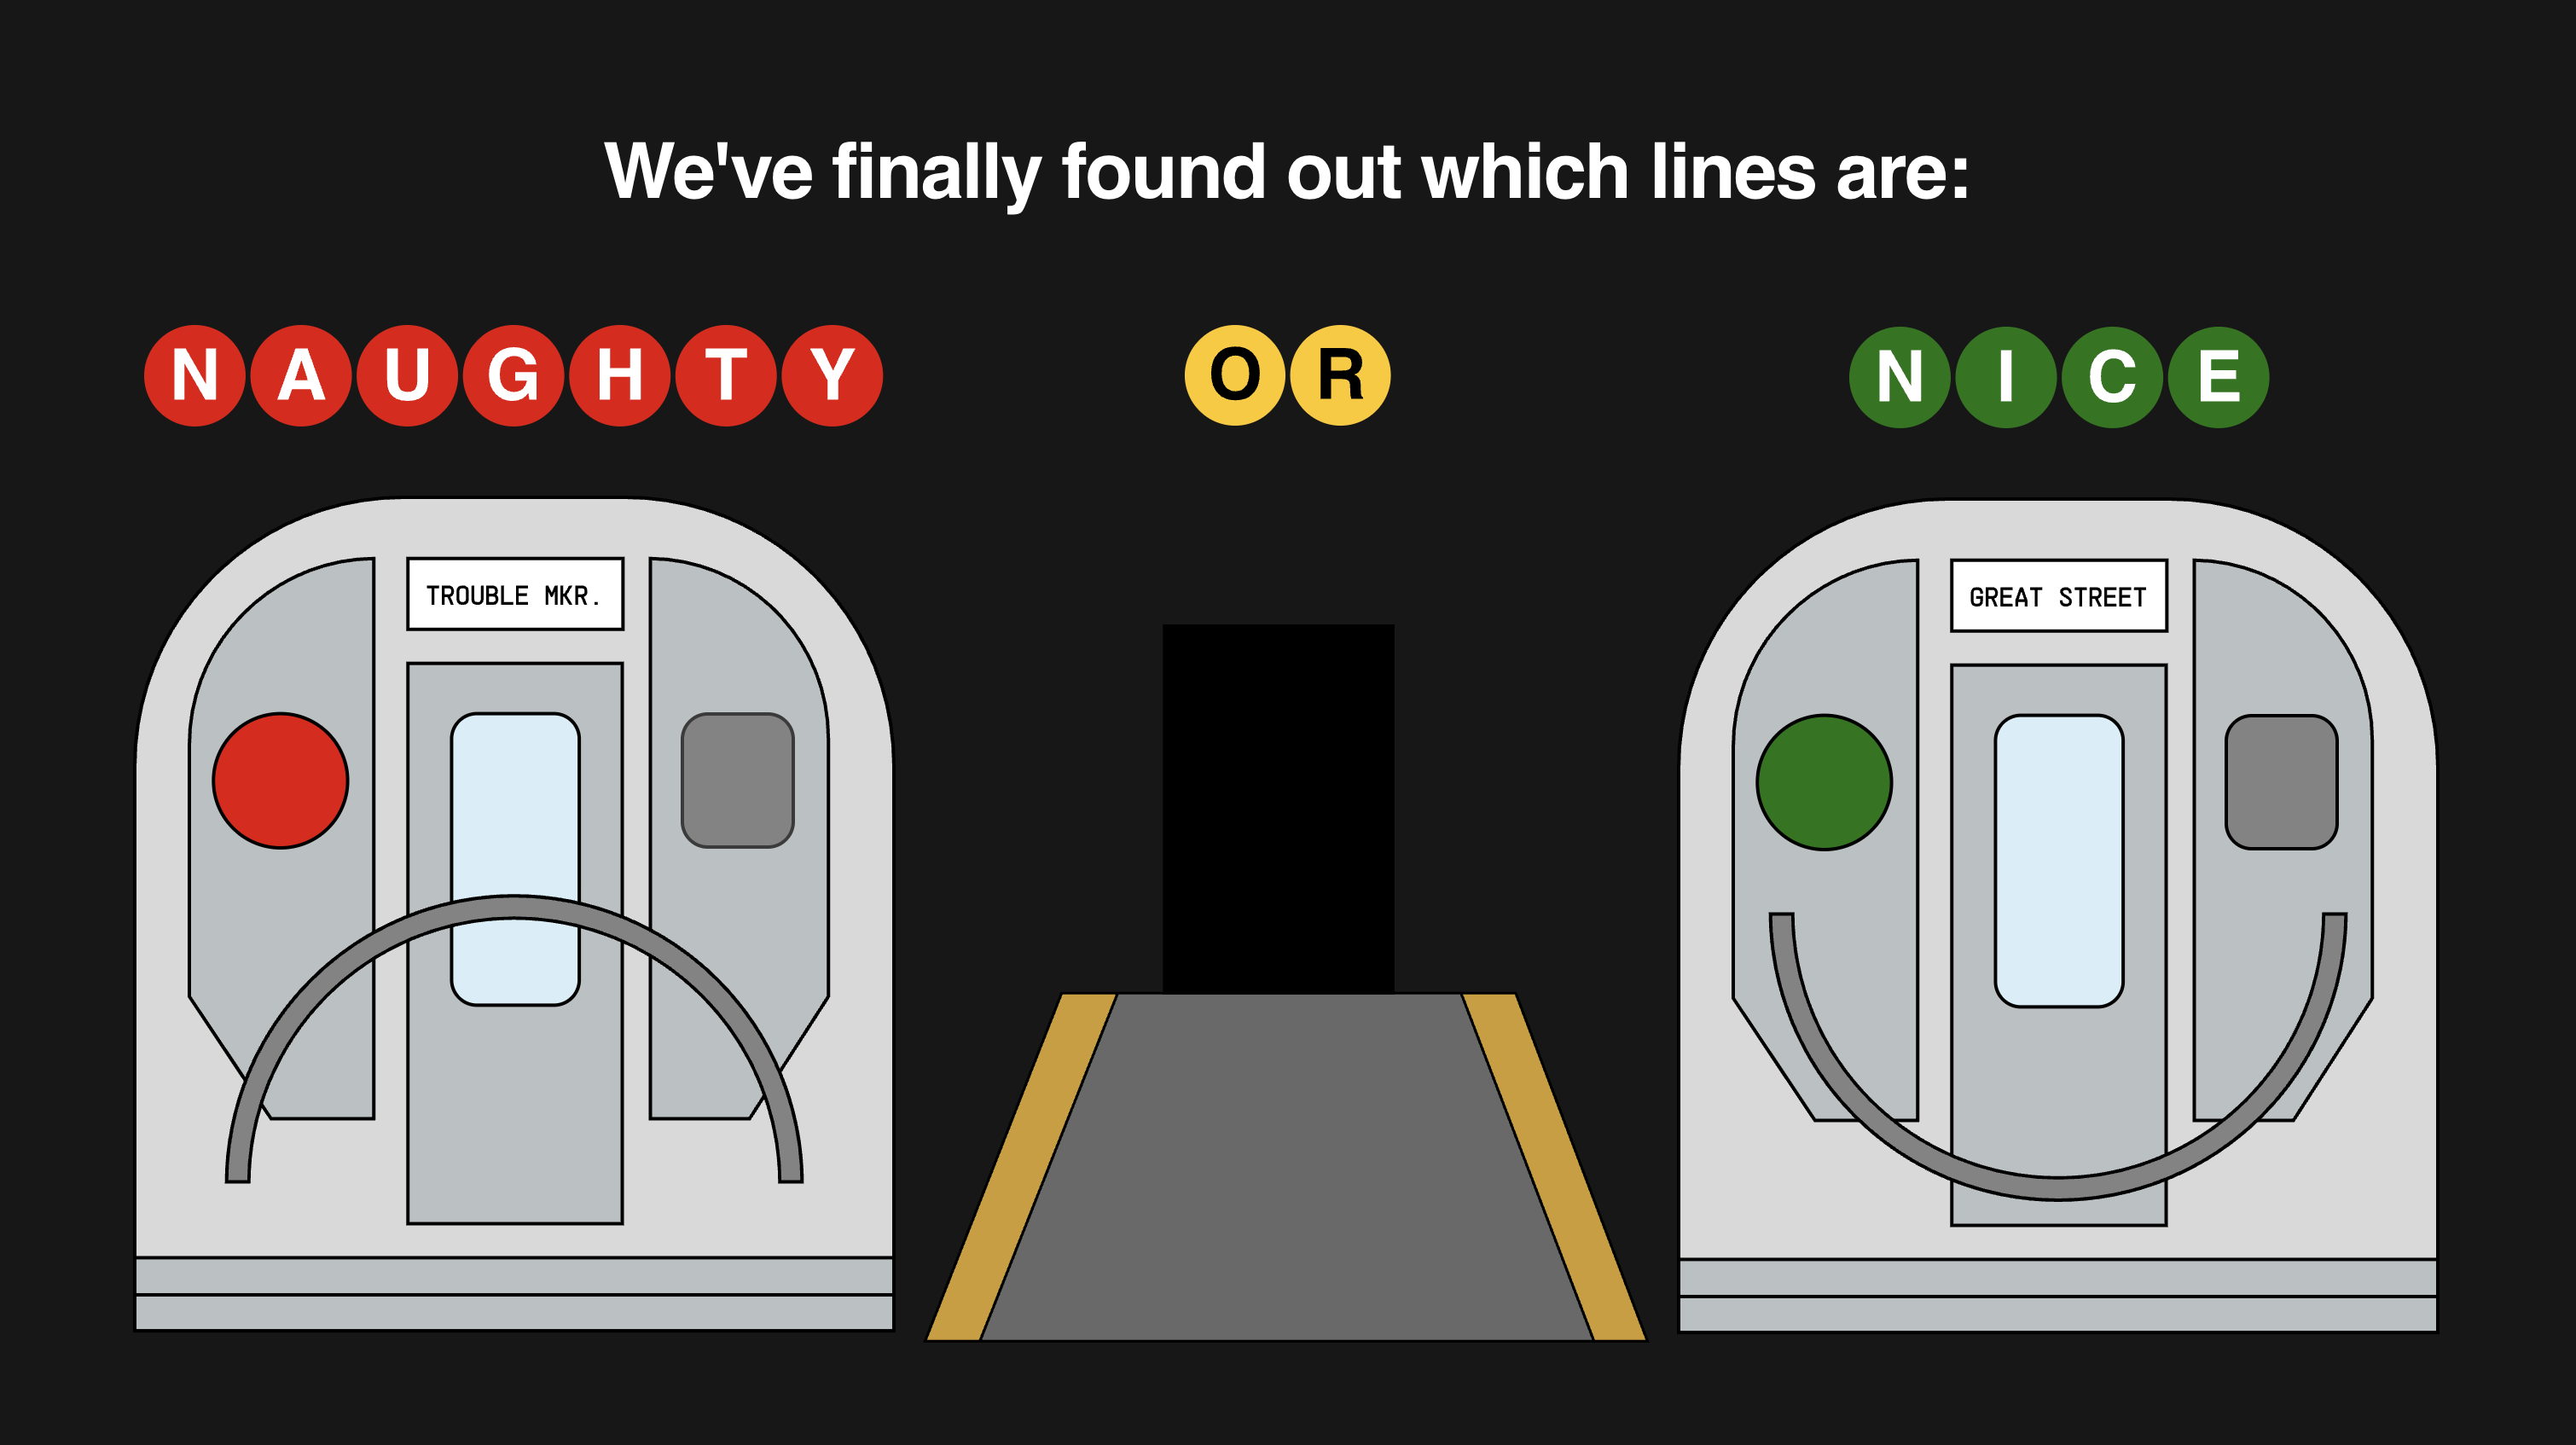
Which line is naughtiest? Which is nicest?
Companies have Employee of the Month, and the New Zealand National Aquarium has Naughty Penguin of the Month, but do we know which service is the naughtiest of the month? And which one is the nicest?
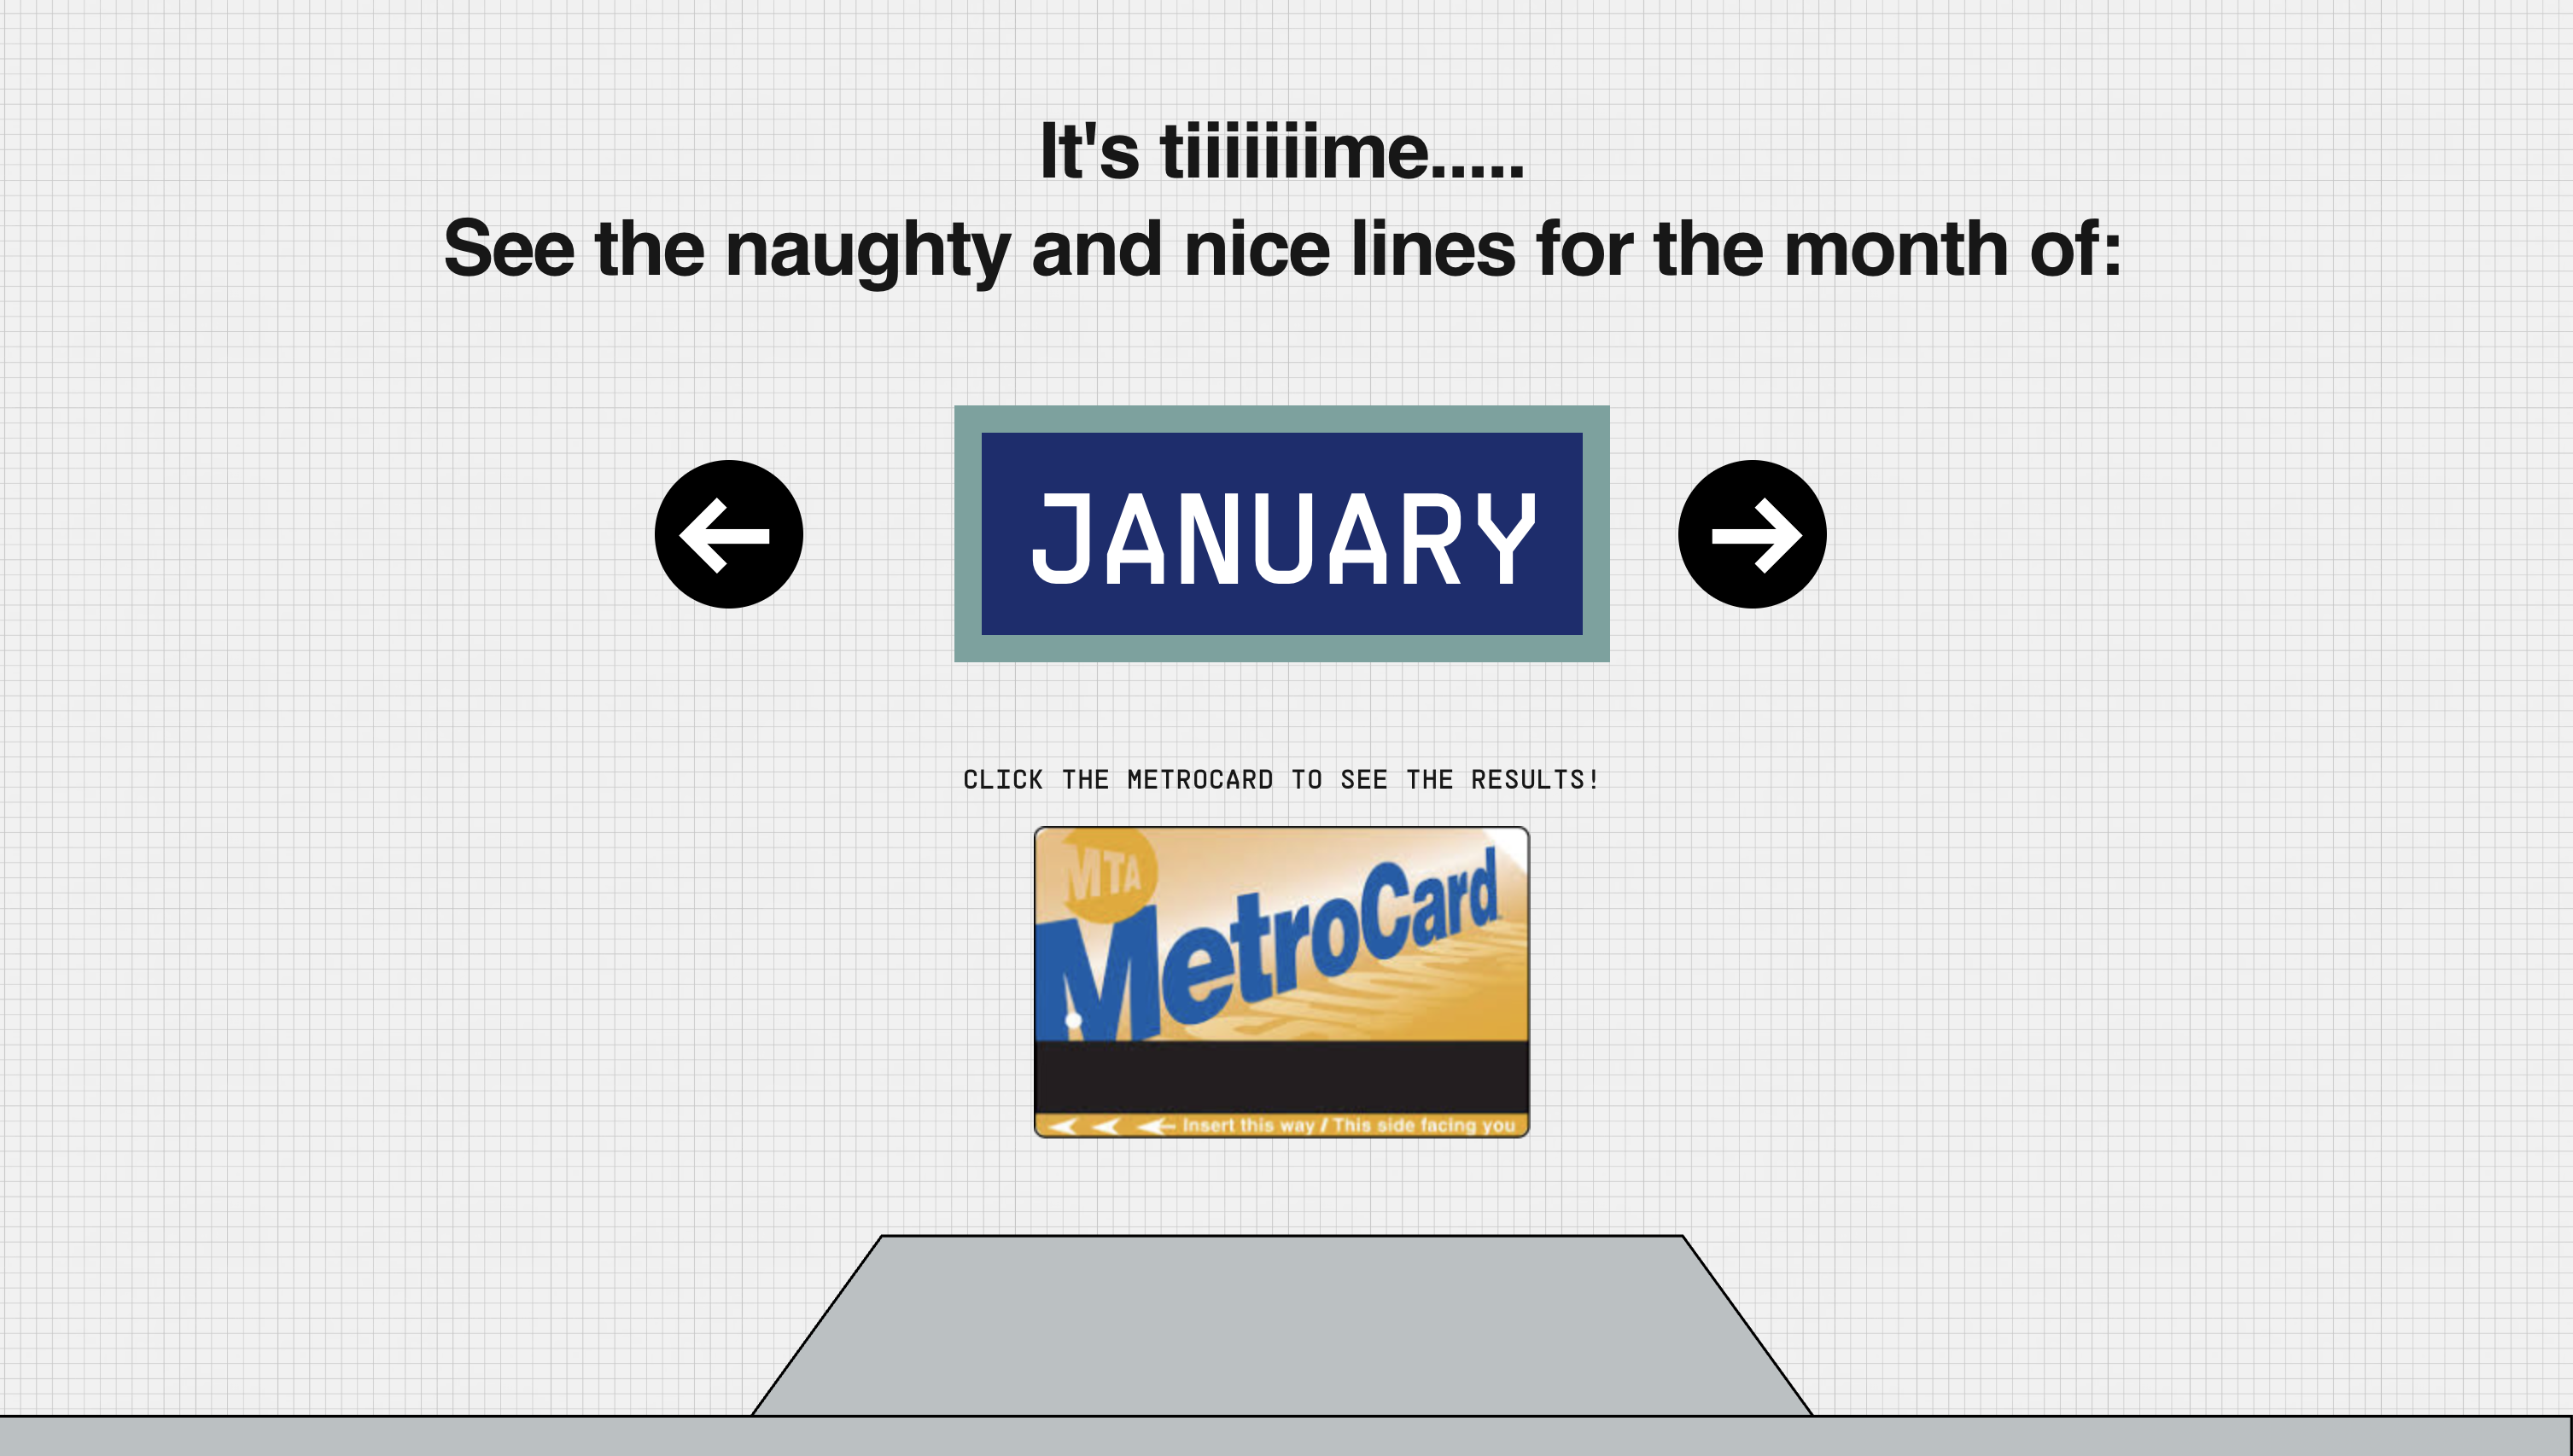
We ranked each service based on three criteria to award the Naughtiest and Nicest Line of the Month for each month in 2023. The criteria are Crowdedness, Timeliness, and Reliability. Each category is weighted the same, and the sum of all three ranks is the final score we use to judge lines, with a lower score (rank) being better. The shuttle services were excluded from our analysis.
METHODOLOGY & DATA
How we measured each category
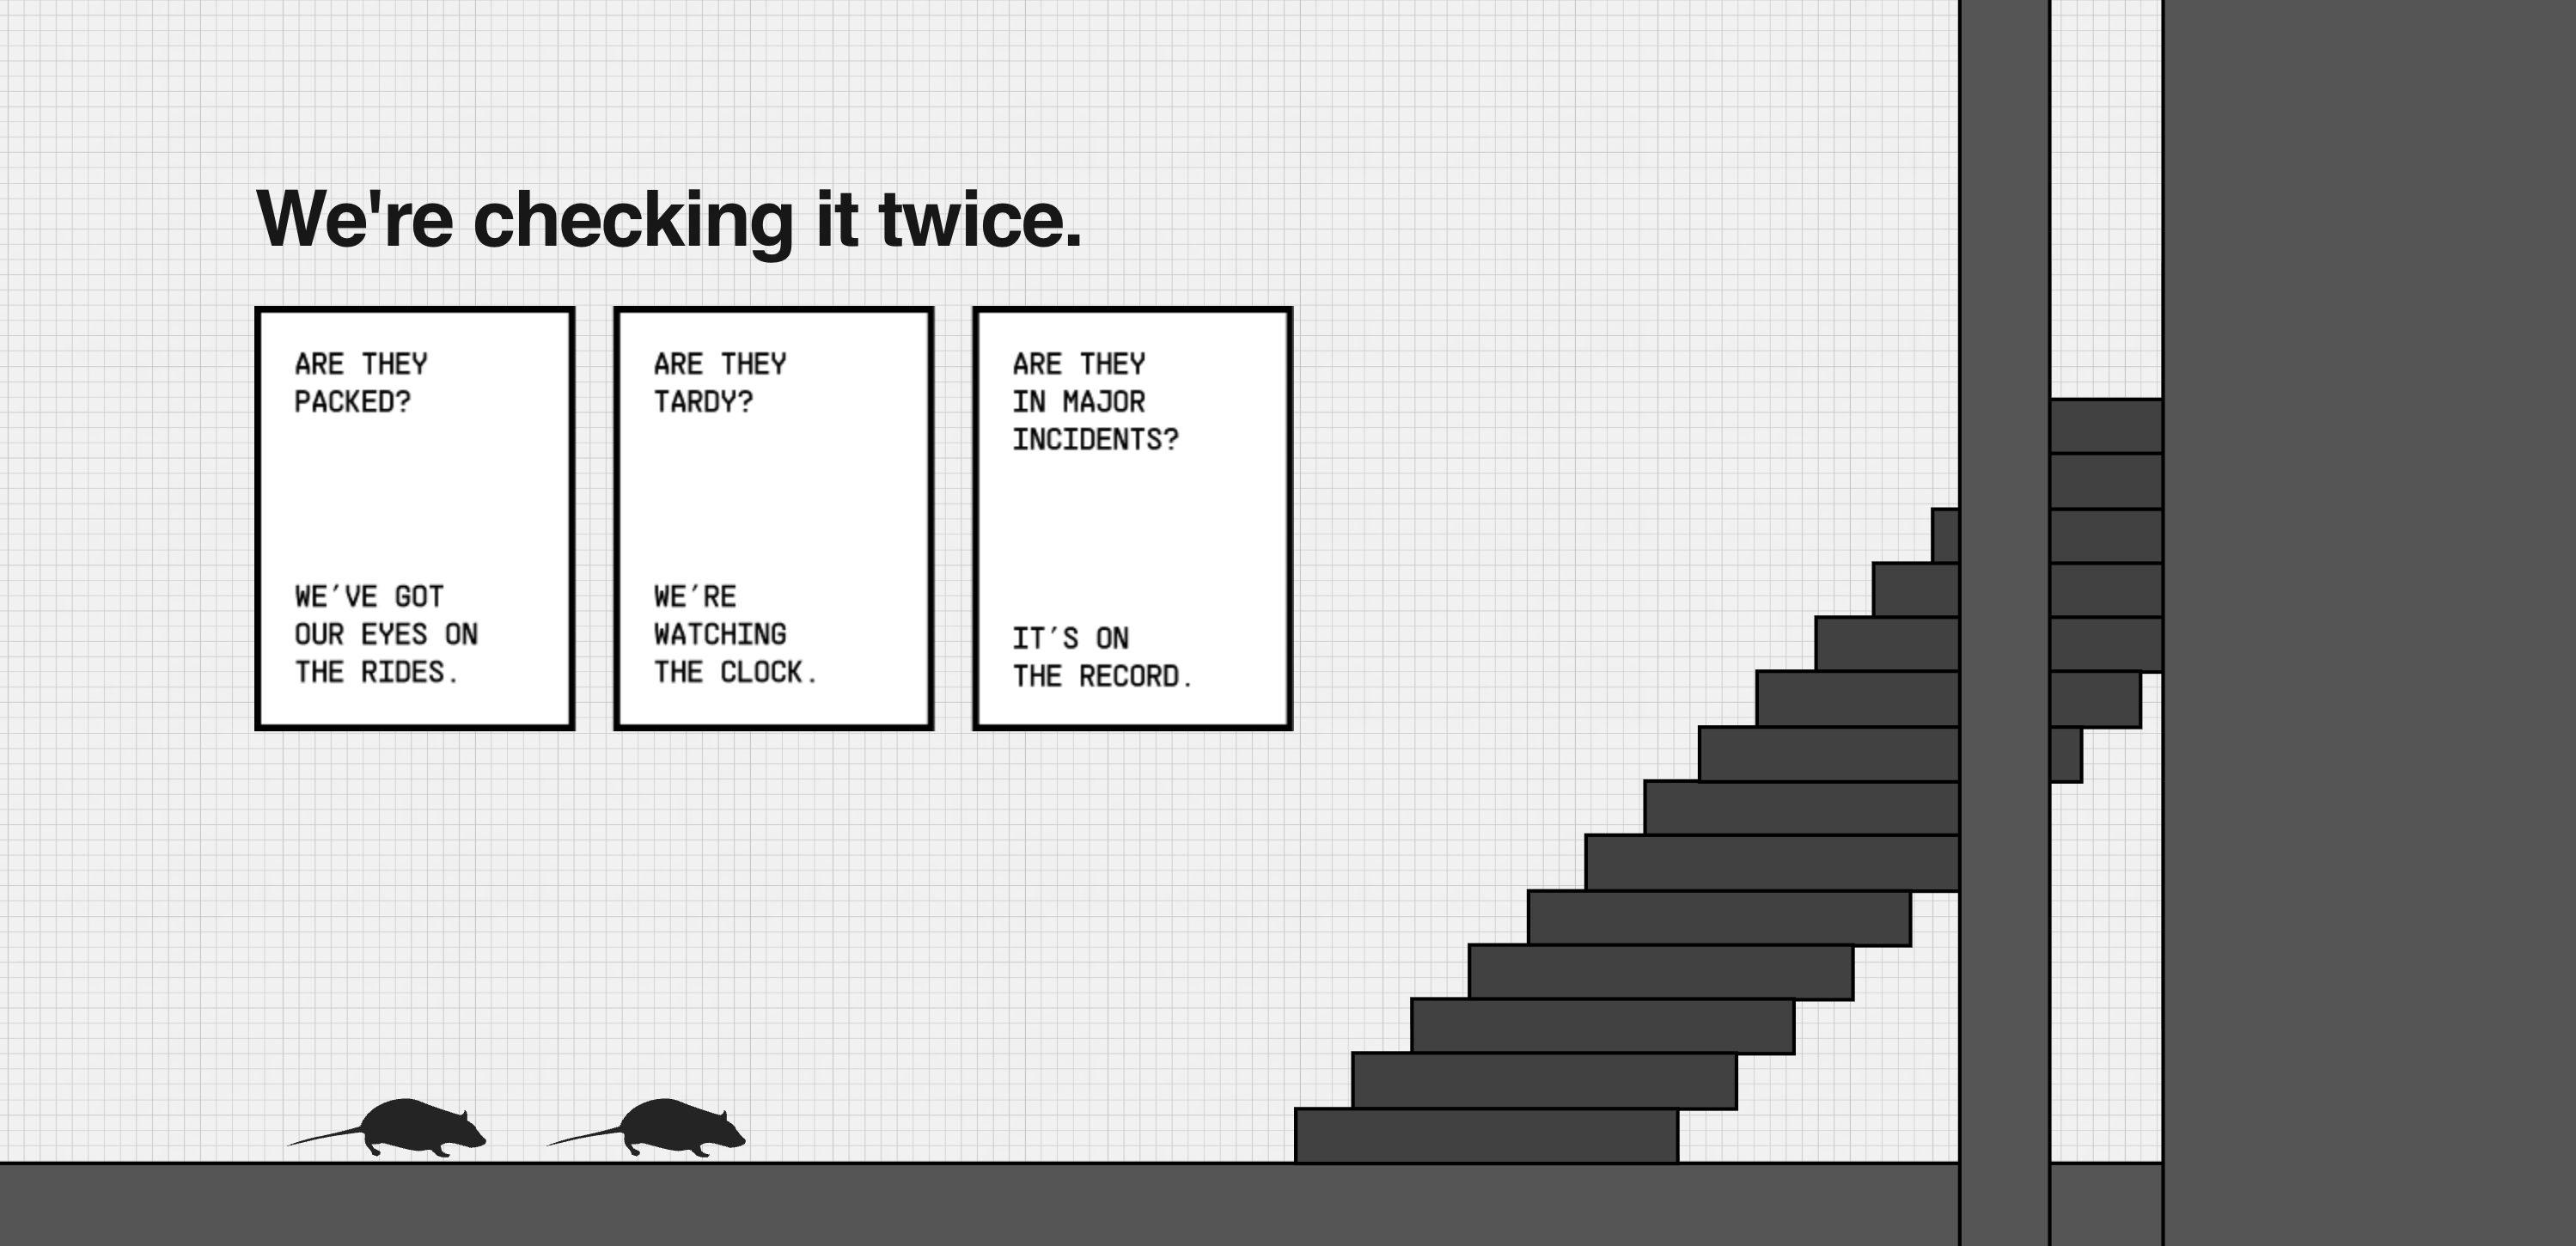
01
Crowdedness
We measured this by calculating the deviation in ridership for each train relative to its yearly average, using the MTA Subway Hourly Ridership dataset (Beginning Feb 2022). Ridership at shared stations is divided equally across services.
02
Timeliness
Timeliness combines terminal_on_time_performance and additional_platform_time from the Subway Customer Journey Focused Metrics and Terminal On-Time Performance datasets (Beginning 2020), weighted equally. Trains with higher on-time performance and lower platform time rank better.
03
Reliability
Reliability is measured by the count of major incidents per line per month from the Subway Major Incidents dataset (Beginning 2020). More incidents result in a lower ranking.
DESIGN PROCESS
Concept evolution
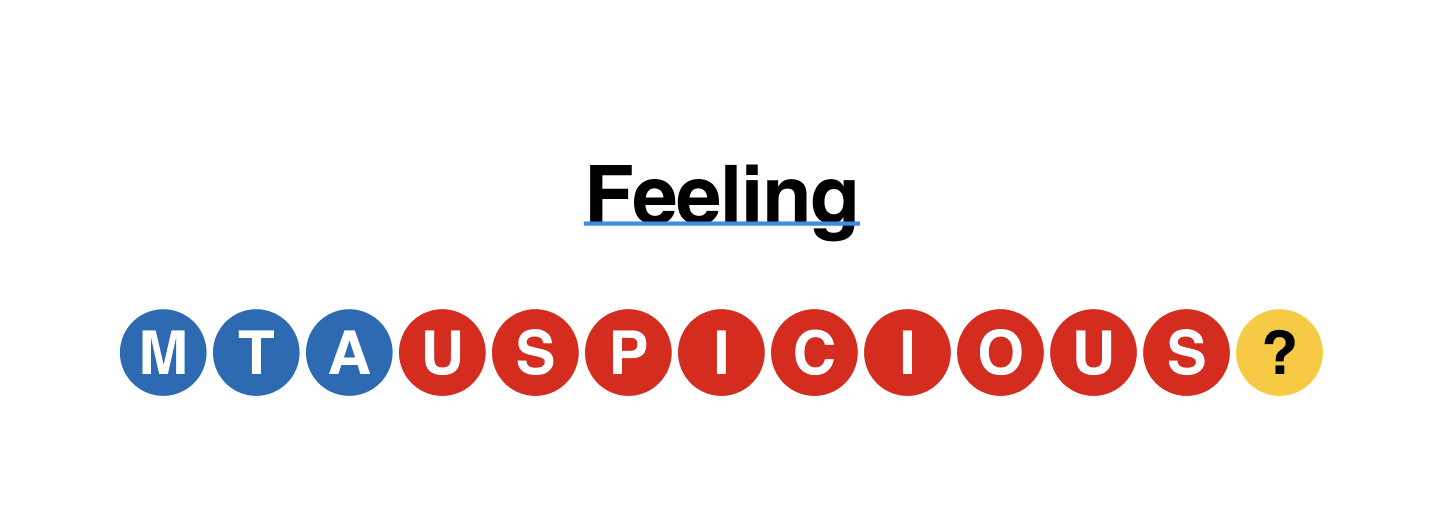
The idea went through a few concept evolutions. We went from an "auspicious day to take the MTA" predictor to a "train karma" concept before landing on the Naughty/Nice checker.
Design took inspiration from the MTA's own design system, with inside jokes like the rat and instantly recognizable elements like colored circles and Helvetica text.
Design took inspiration from the MTA's own design system, with inside jokes like the rat and instantly recognizable elements like colored circles and Helvetica text.
INTERESTING FINDINGS
There's a lot we learned about the MTA!
01
Reliability doesn't tell the full story
Several trains had the highest Reliability rank of a month, but poor ranks in Crowdedness and Timeliness, such as the D train in December 2023.
02
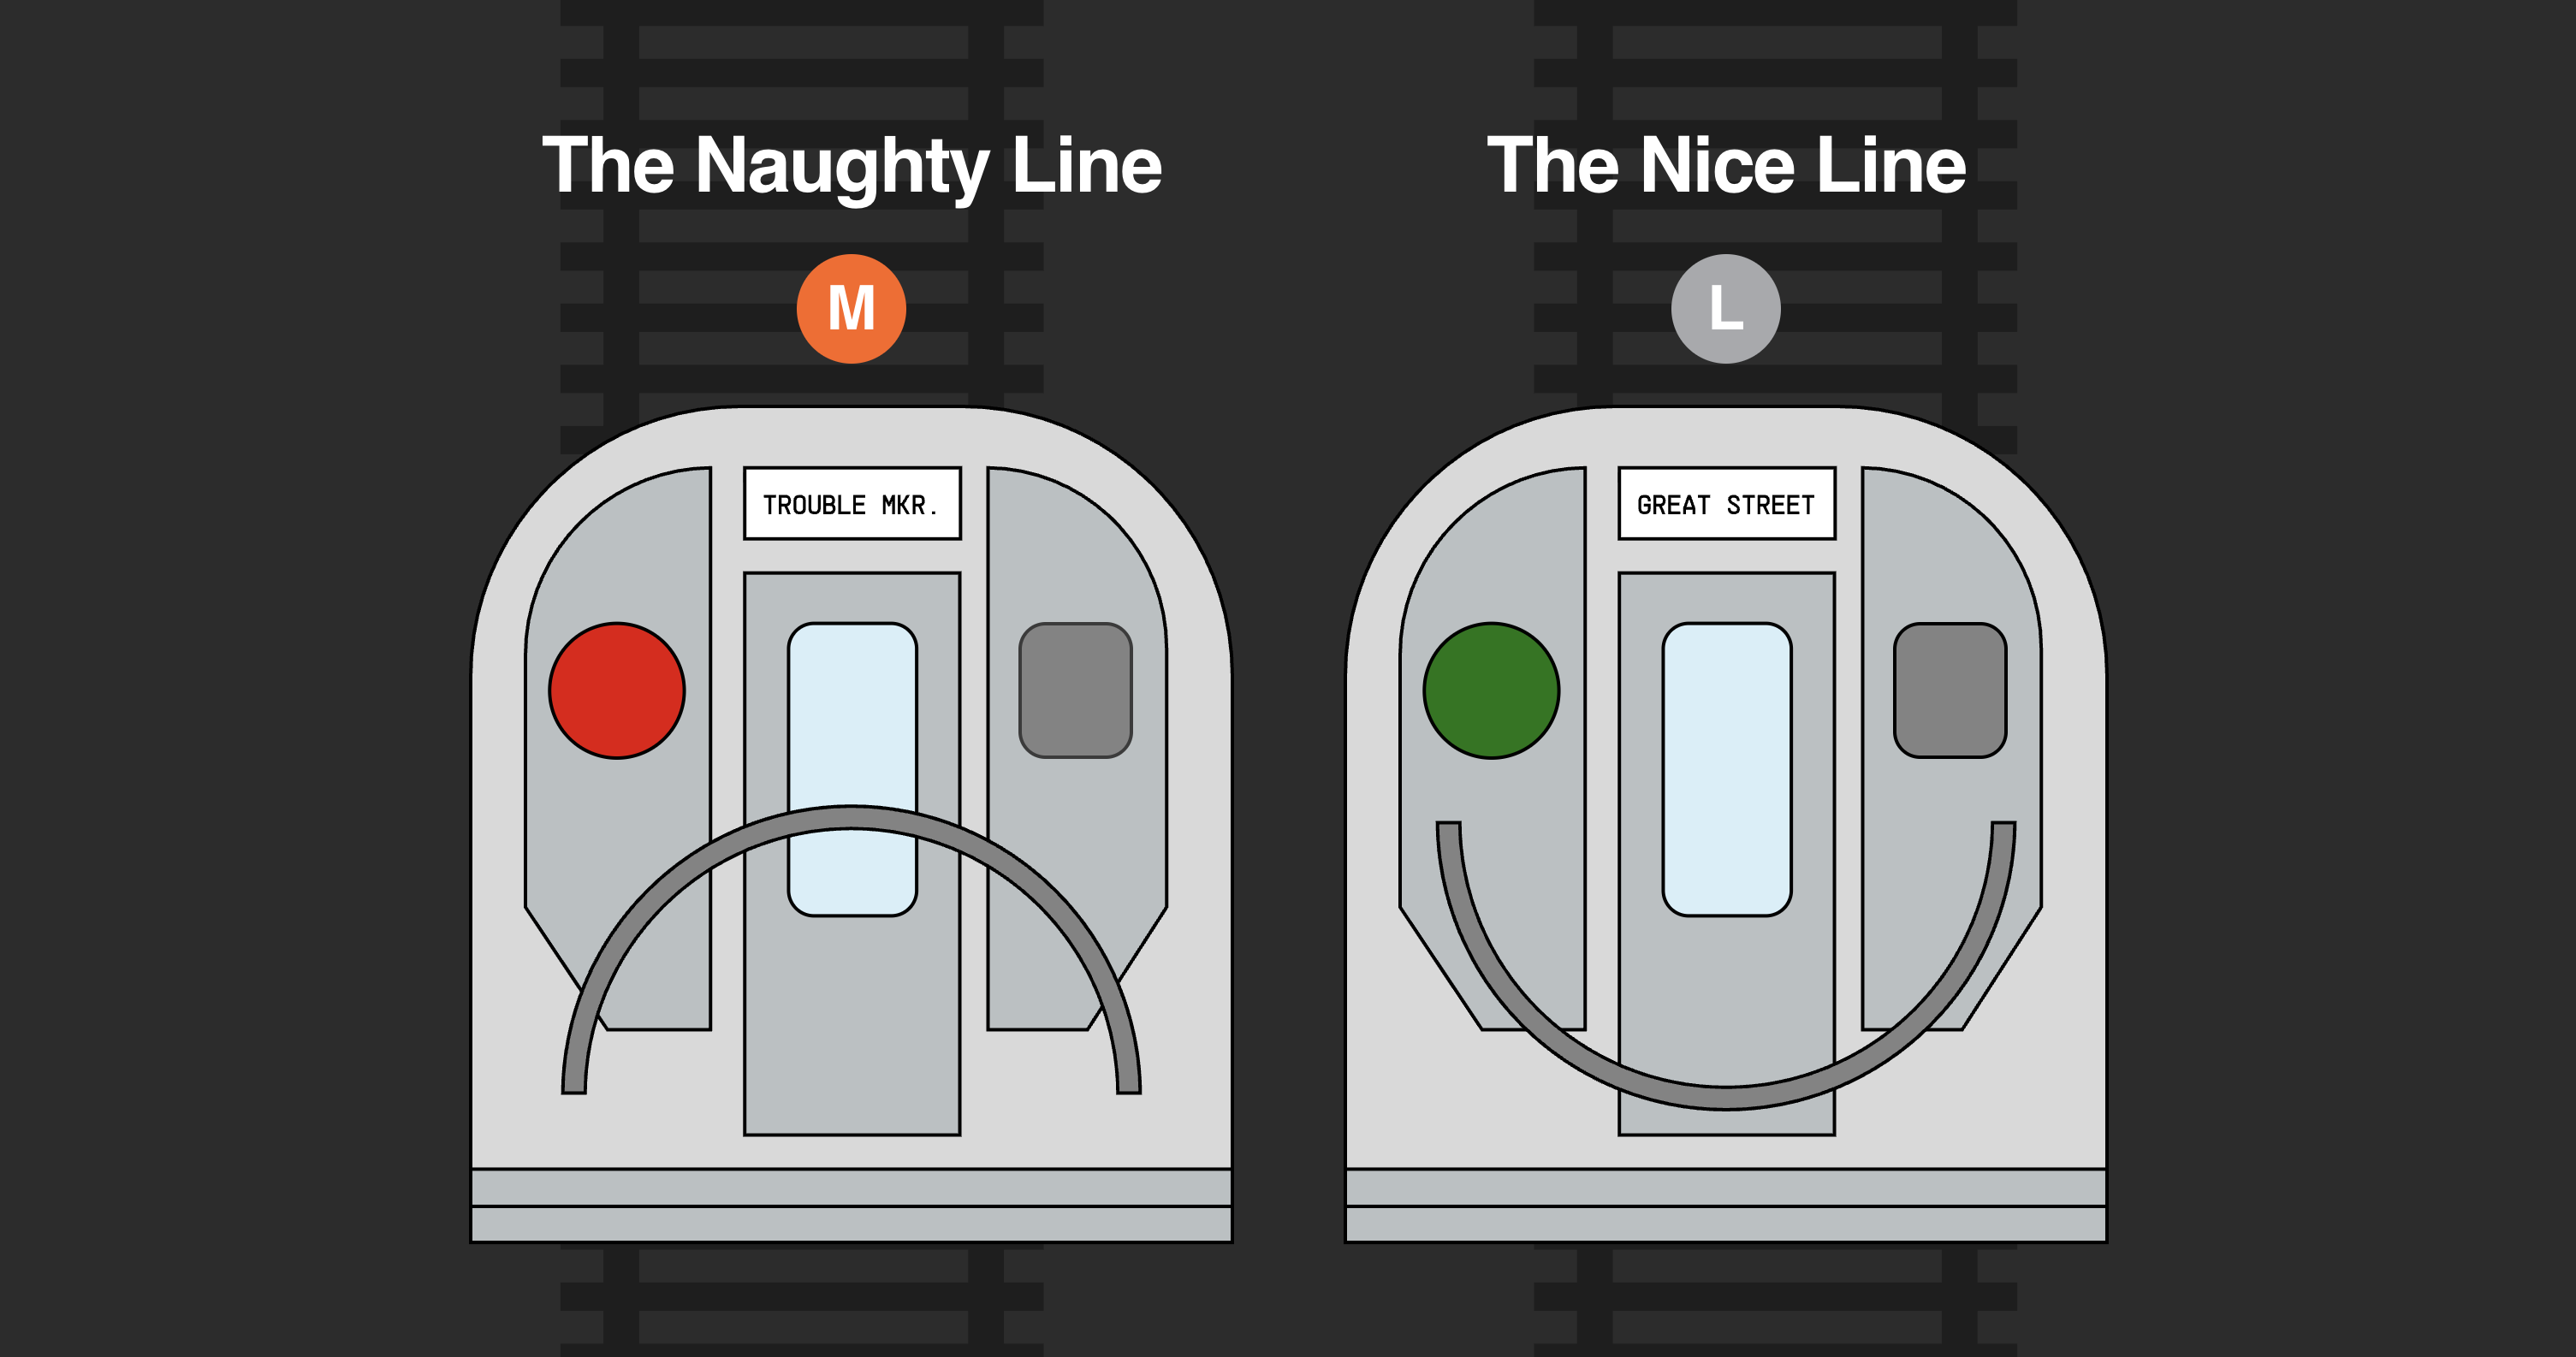
L train: Nicest champion
The L train won Nicest Train of the Month the most, for a total of 5 times in 2023.
03
M train: Naughtiest champion
The M train won Naughtiest Train of the Month the most, also for 5 times in 2023.
04
IND lines dominate naughty awards
Only IND lines won the Naughtiest awards.
LEARNING & IMPACT
Make it clear, make it easy, make it fun!
I got quickly up to speed with how to make an opinionated design feel familiar and fun. If I had more time, I would have loved to add more motion elements, animations, and interactive 3D stuff.
We also got featured by the MTA in their 2024 Open Data Challenge roundup!